Research
Ideas and open questions between data visualization and drawing.
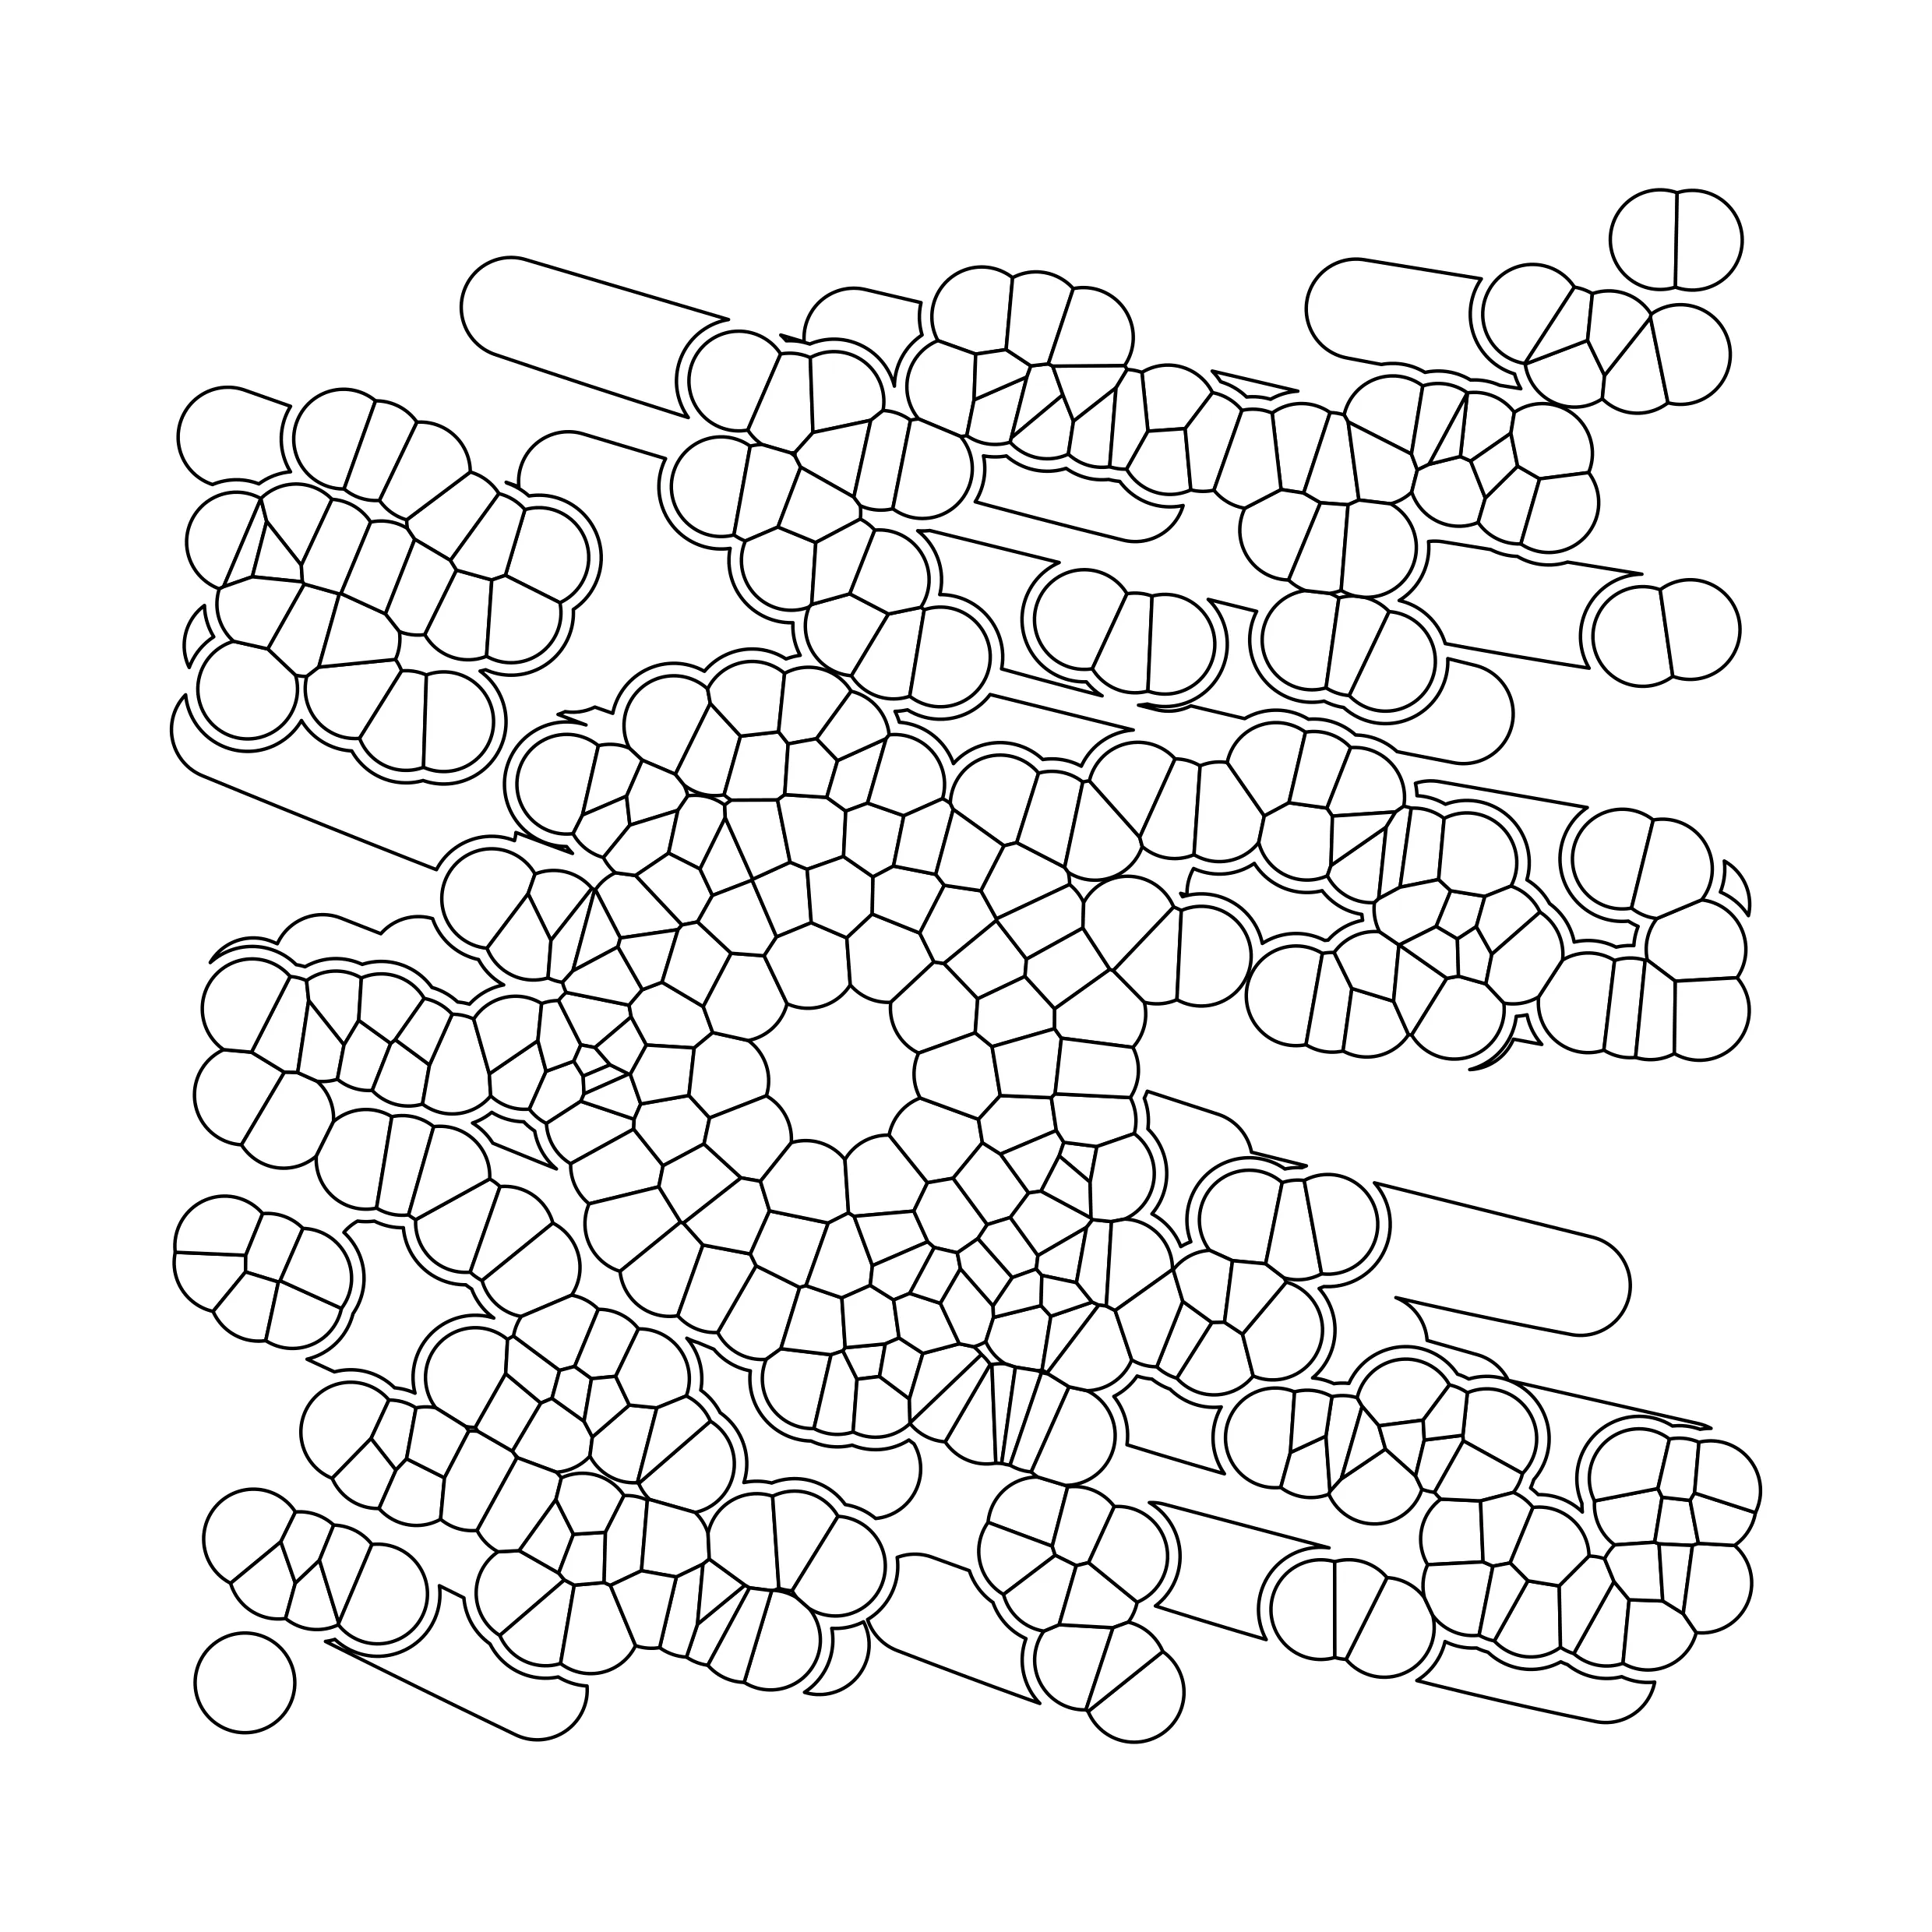
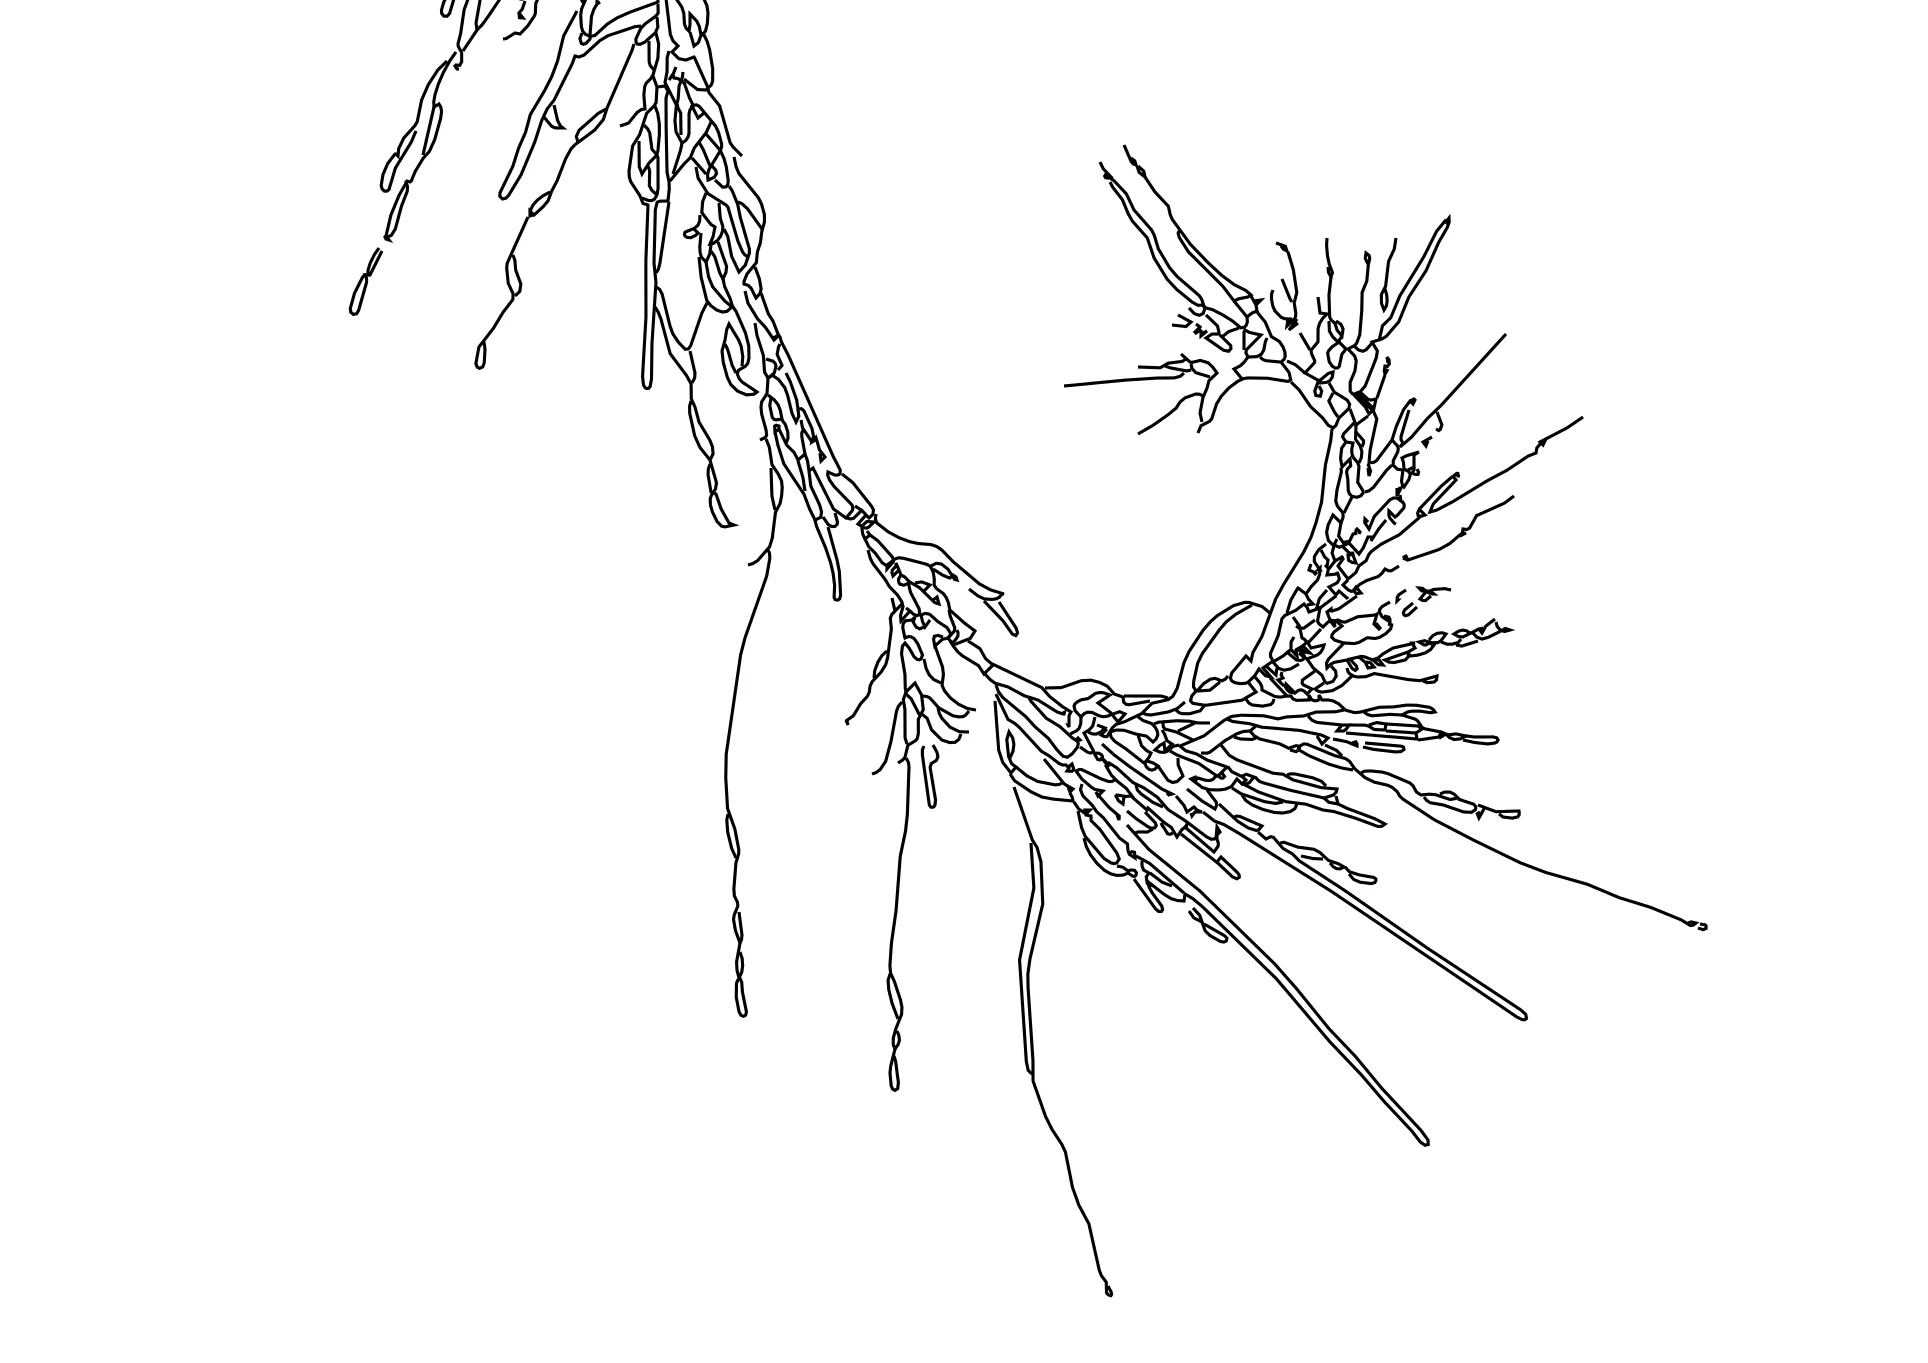
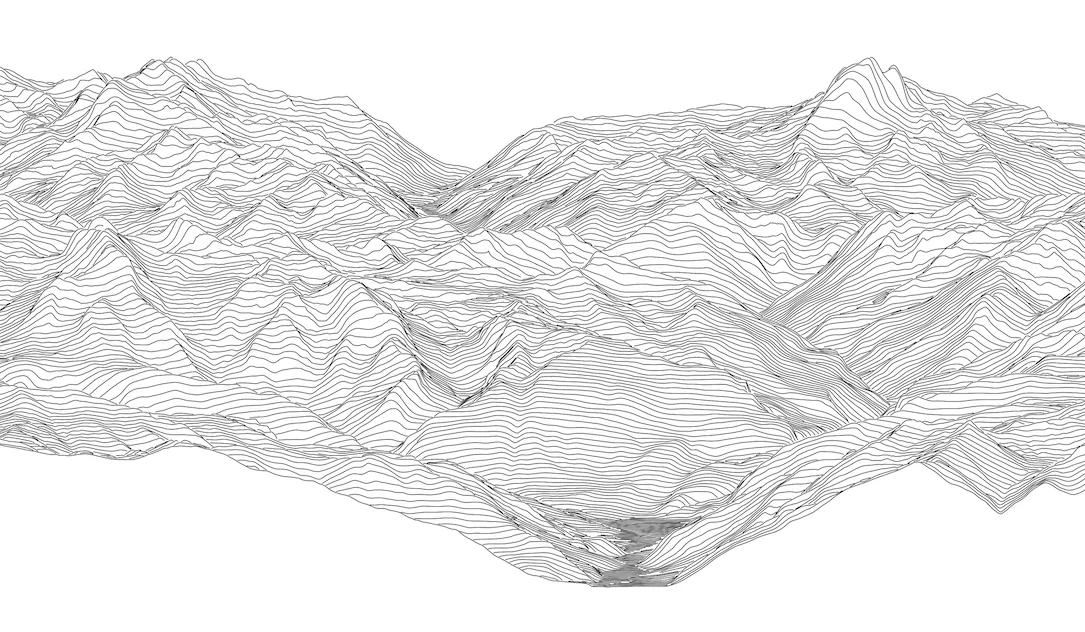
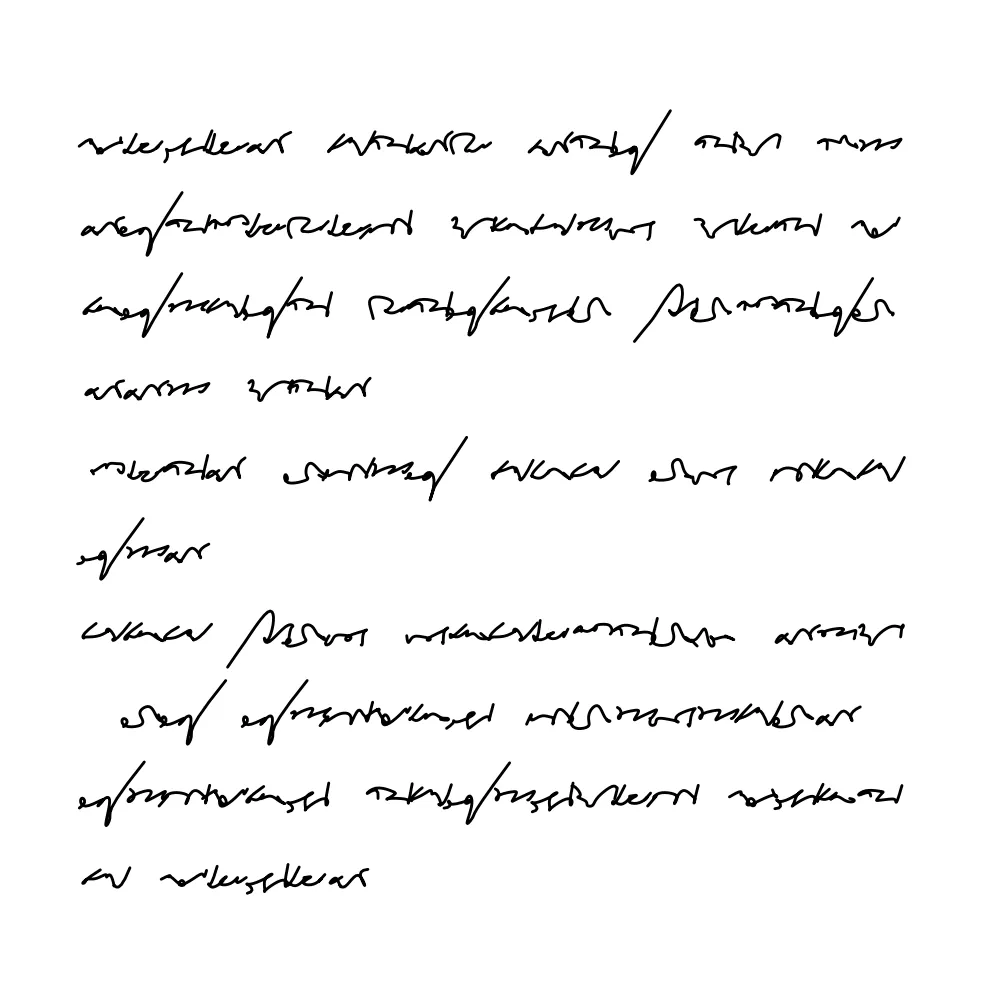
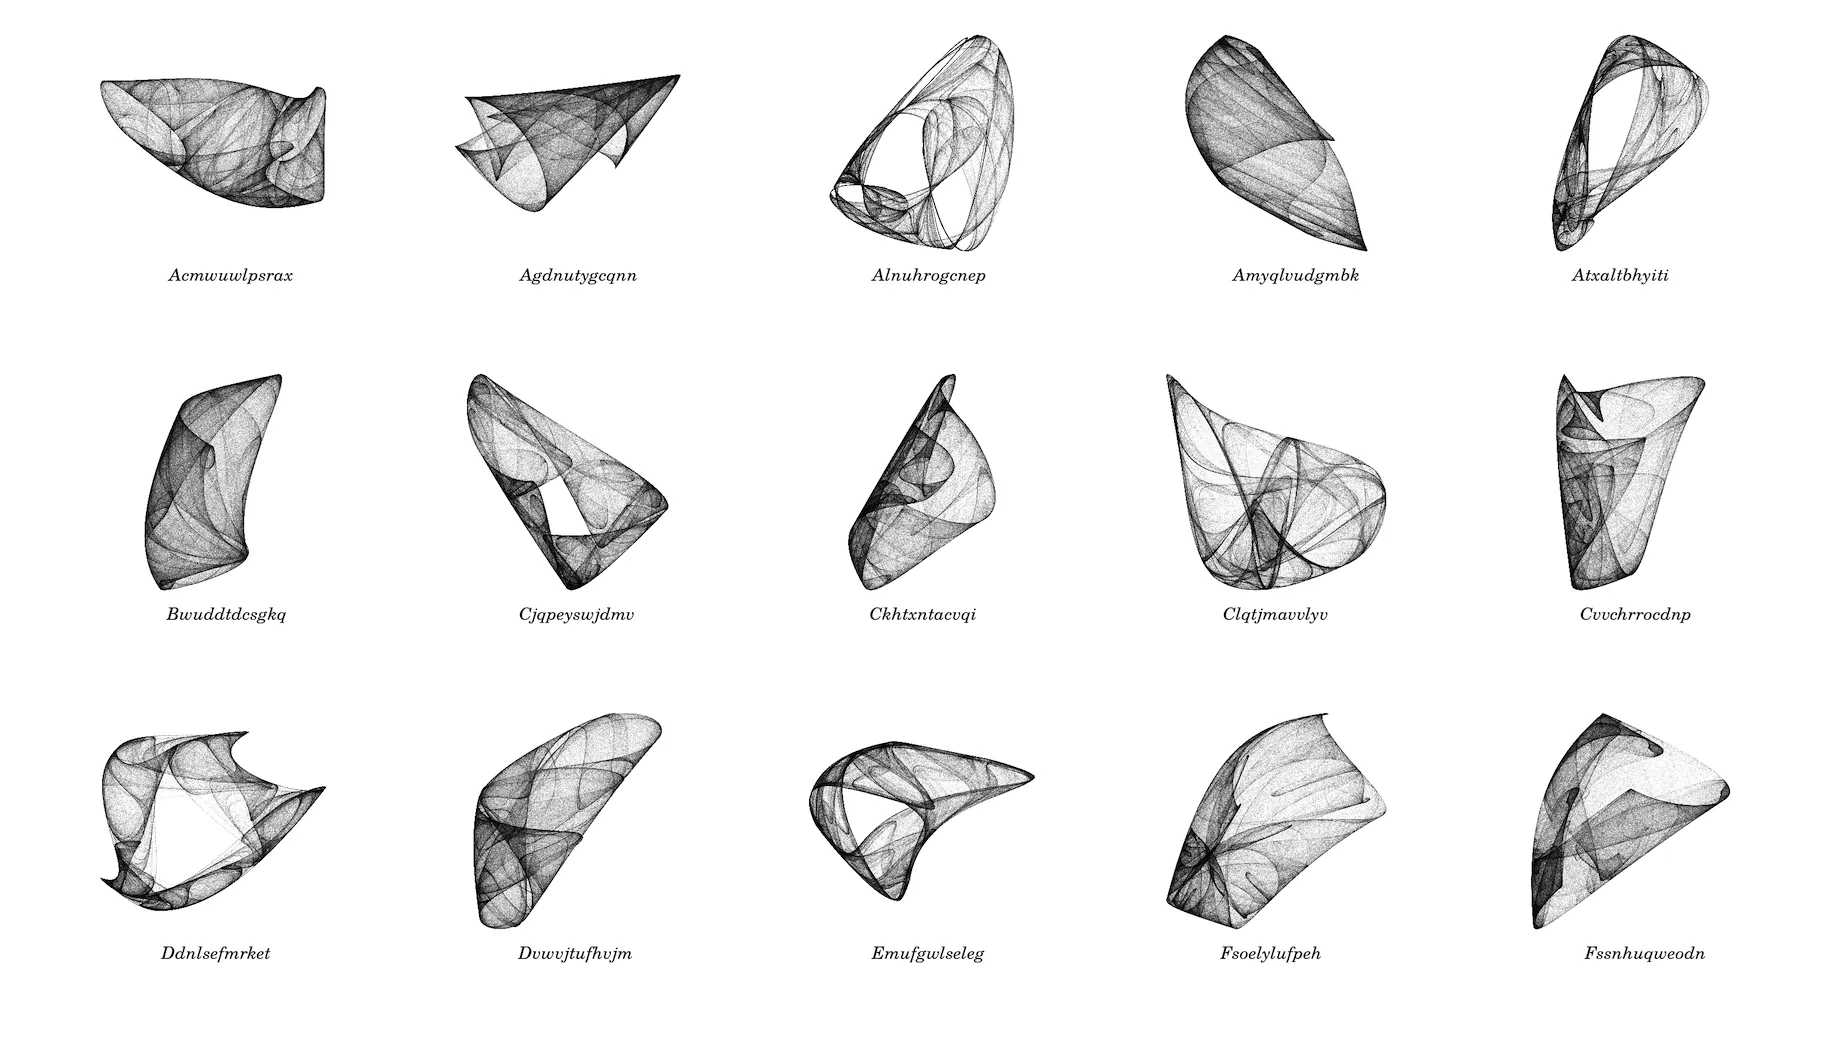
I use the R programming language to write algorithms that generate digital images. The idea is to code a sequence of operations, balancing designed rules and randomness, that generates a new output each time it is executed. These outputs, vector images, are instructions to drive a pen plotter, a mechanical method to draw those images on paper.
I often start from existing datasets, treating them as malleable materials to craft diverse visual representations. The whole process is very much like repurposing a tool originally made for statistical analysis and quantitative display of information for artistic endeavors.
By transforming data into ink on paper, i’m considering technology as a tool to investigate, to raise new questions rather than solve them. Sometimes the algorithm produces exactly what was expected, very predictable. Other times it generates something surprising, because of the randomness, an unexpected combination of factors, or even a coding error, and this can become an interesting starting point for the next iteration.
On my mind
Can the feedback loop between coding and visual outputs develop a particular kind of intuition?
What can ink painting and calligraphy teach about expressivity in a digital and mechanical process?
Can code help think in the way of Chinese landscape painting, to generate landscape as a process rather than depict it as a view?
Systems
No matching items