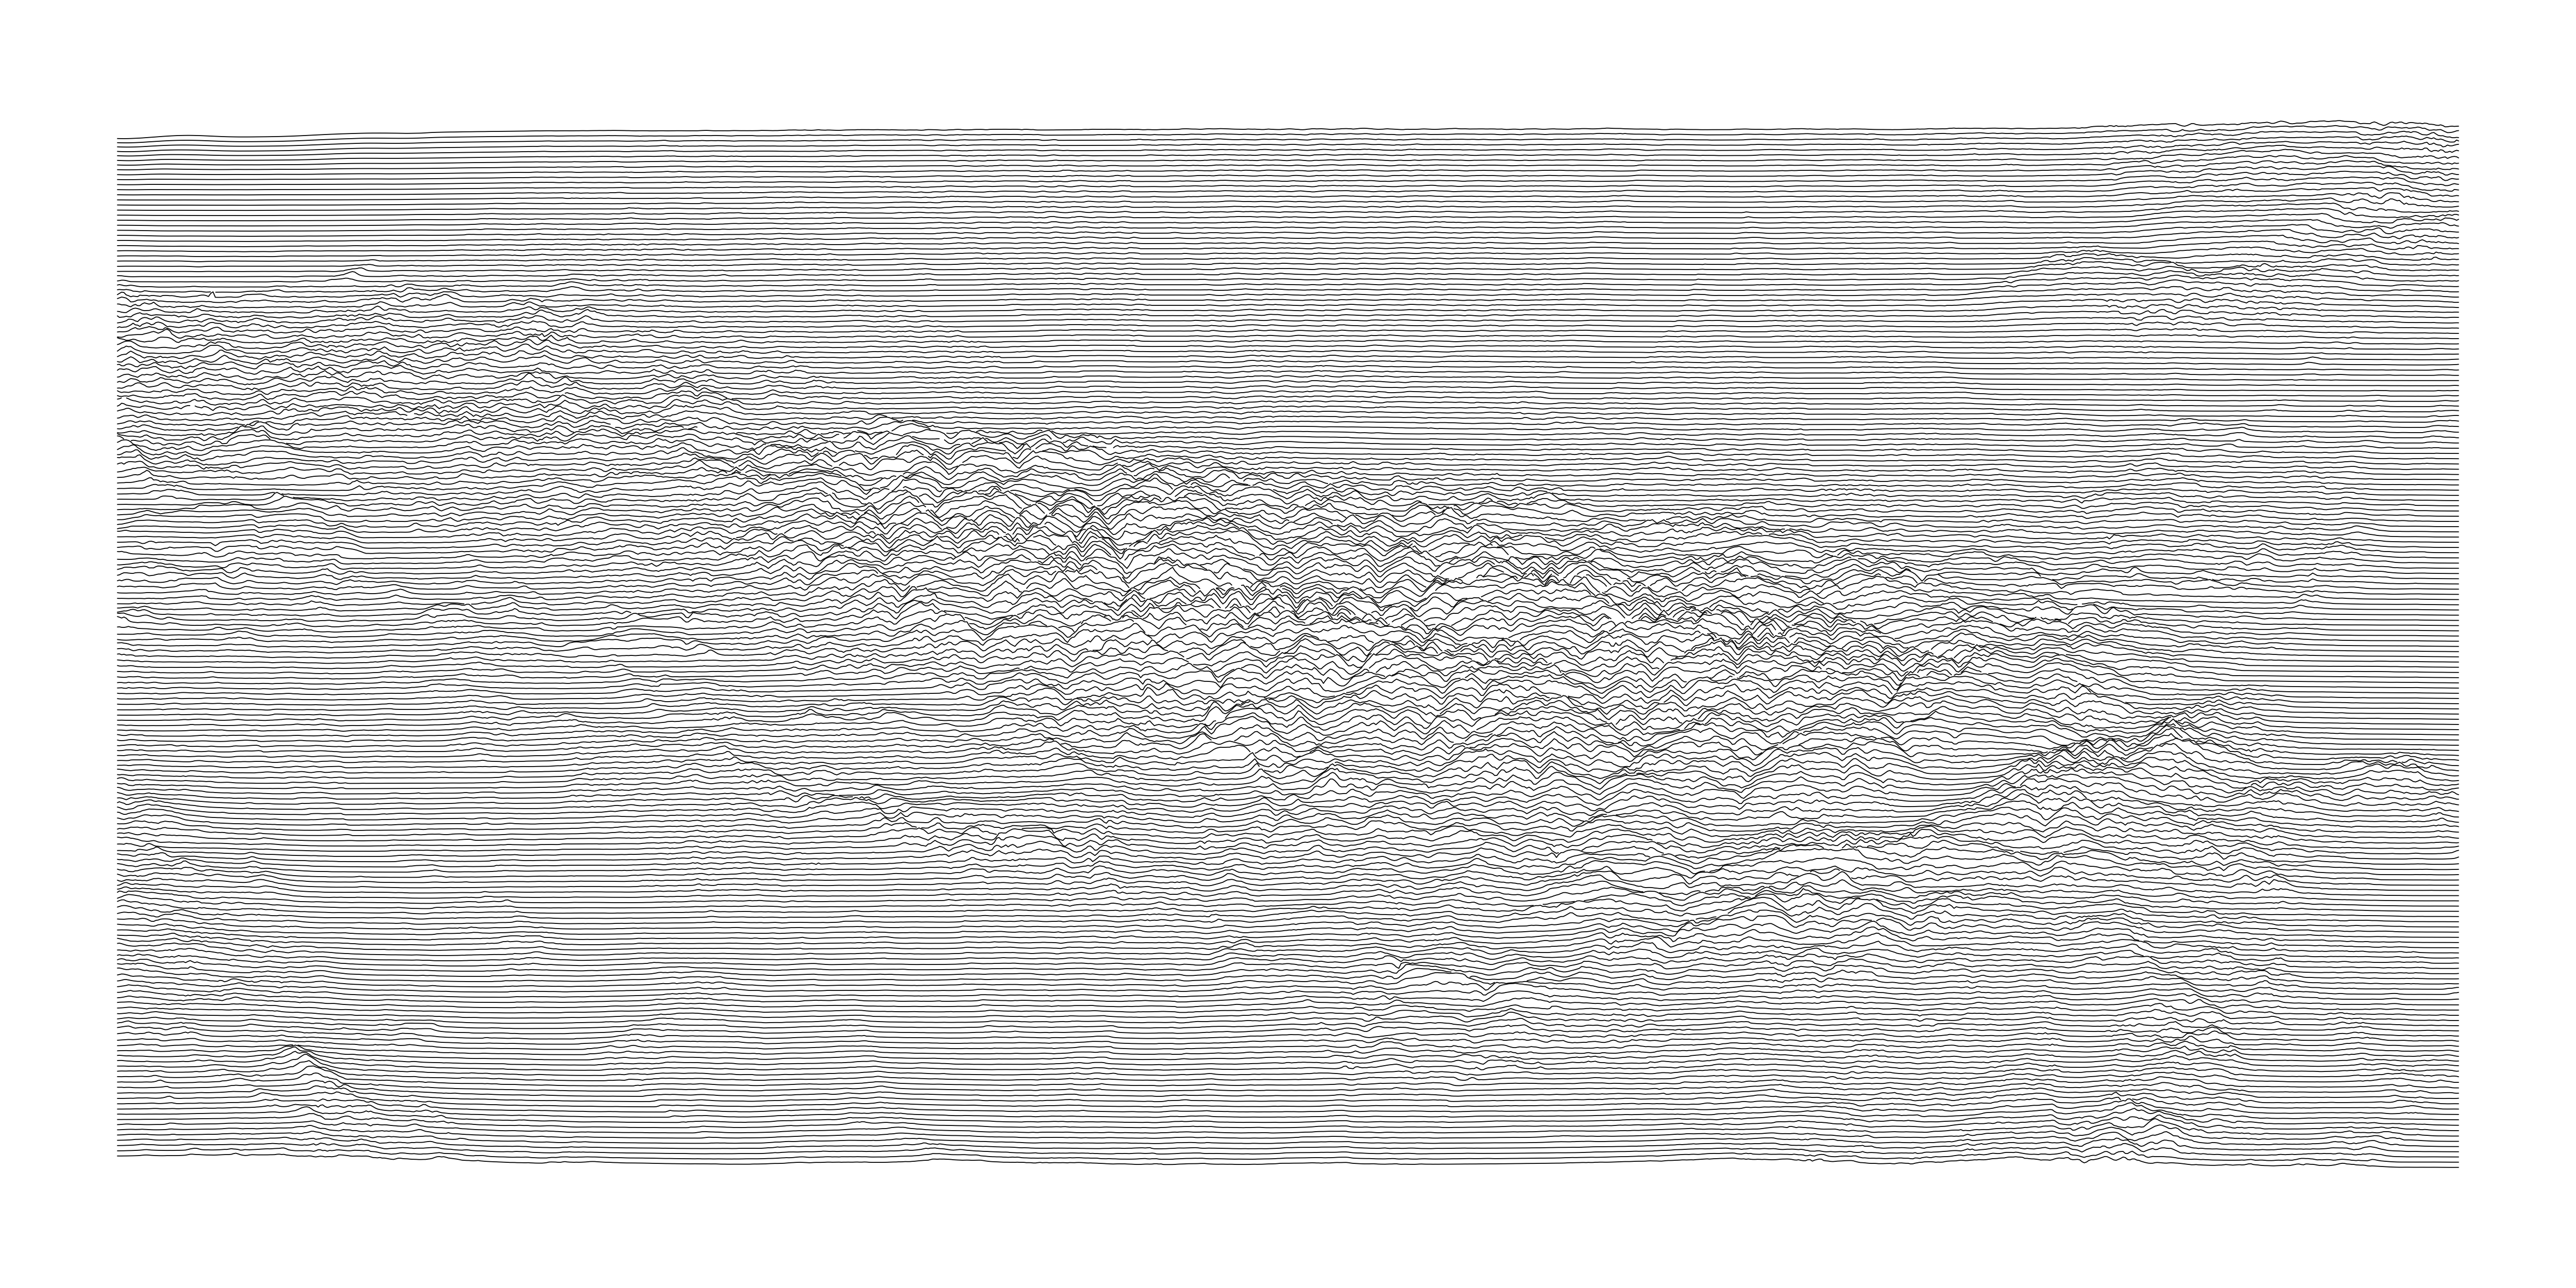
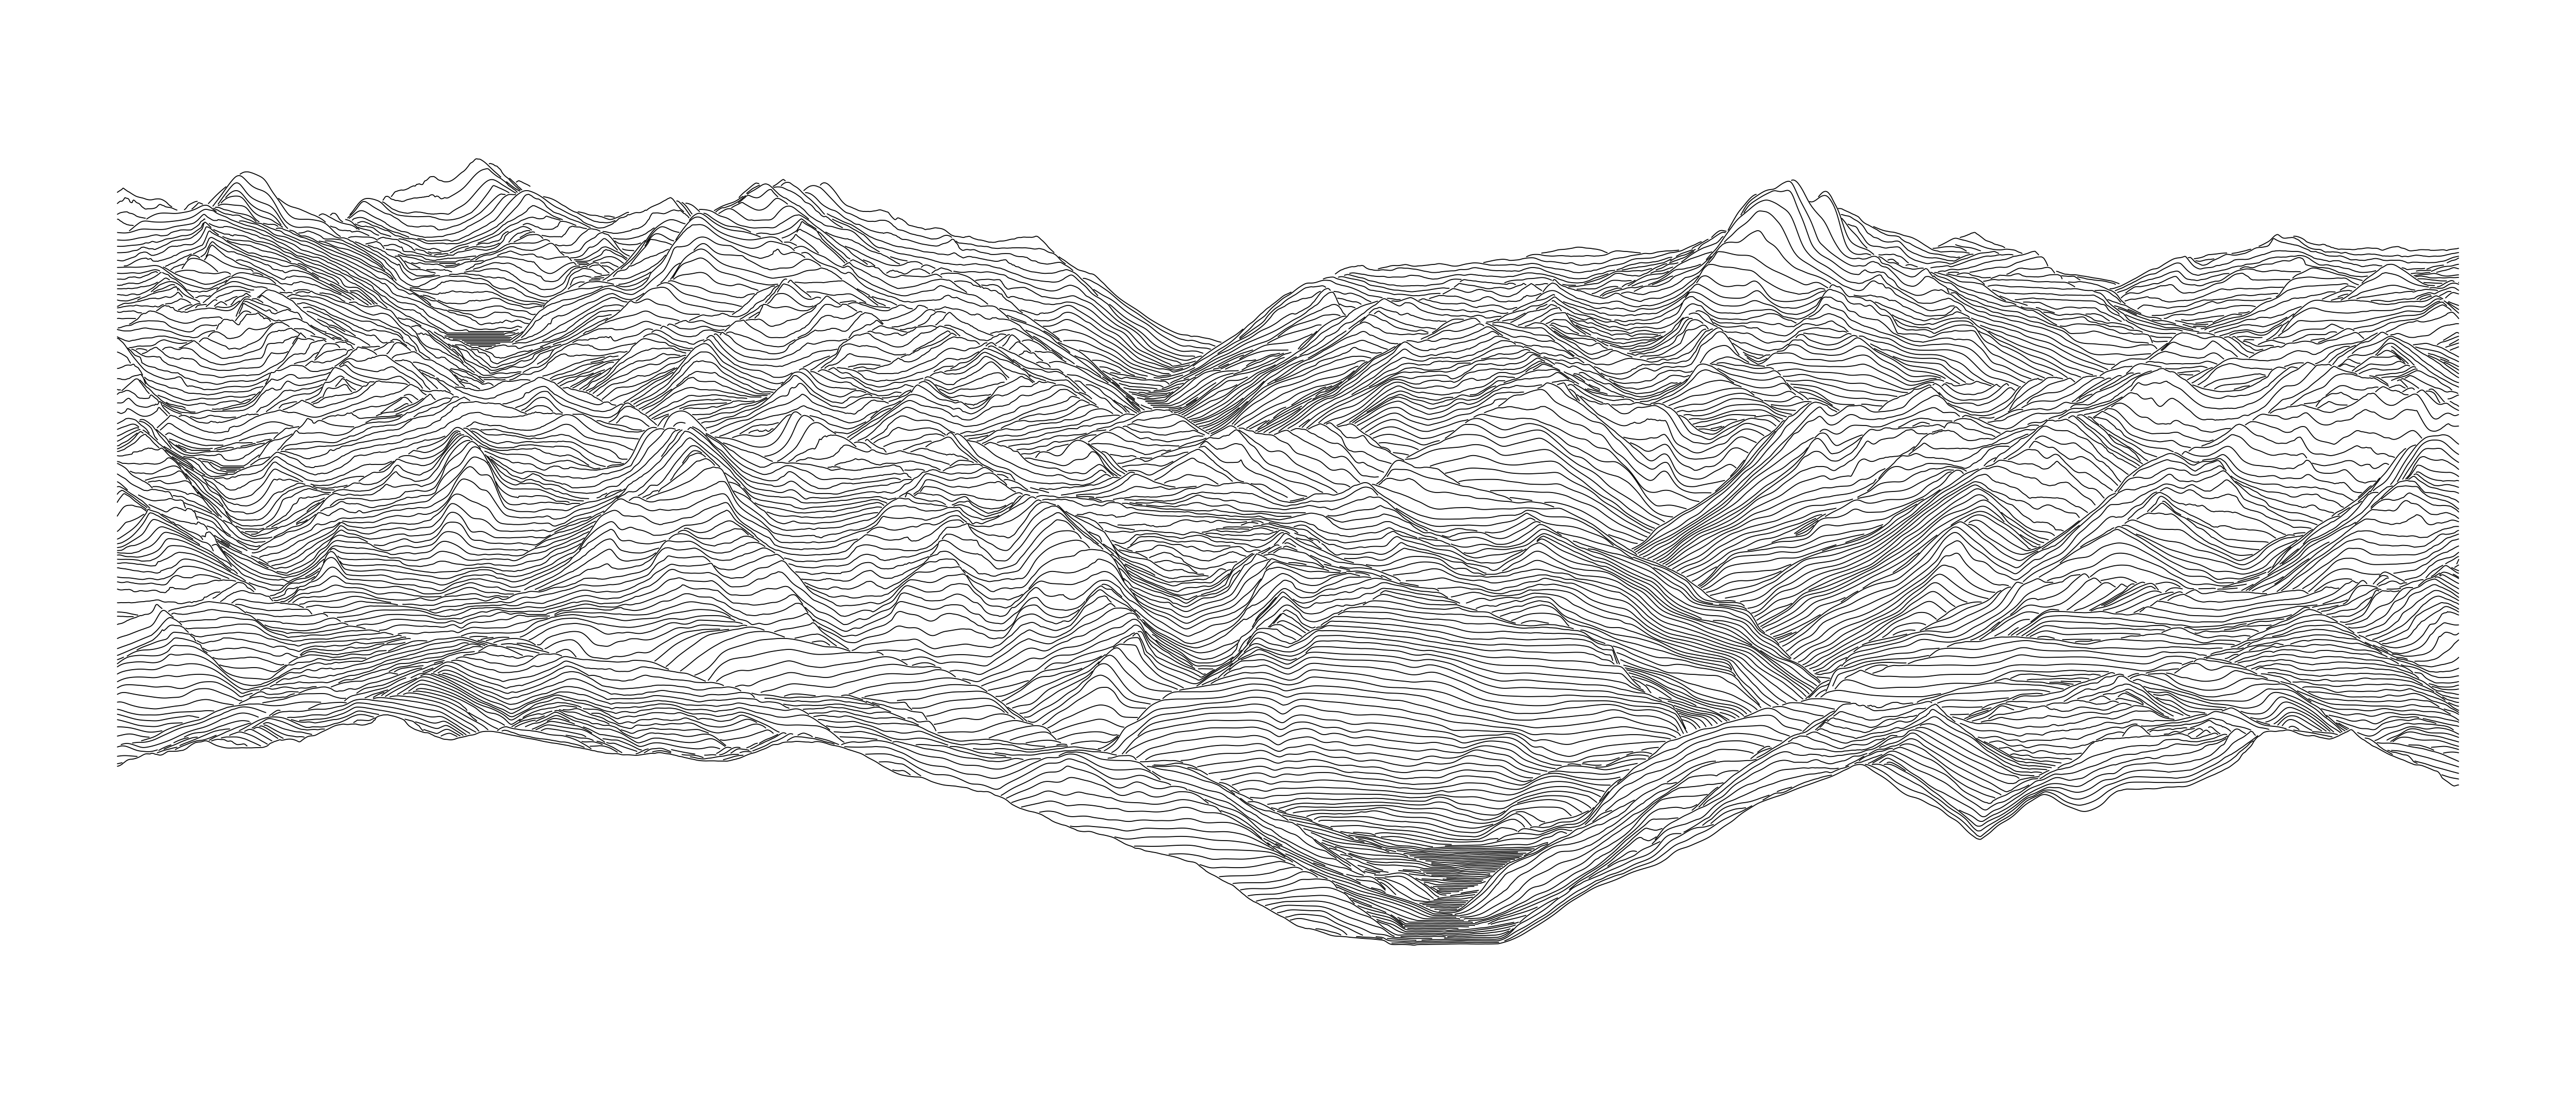
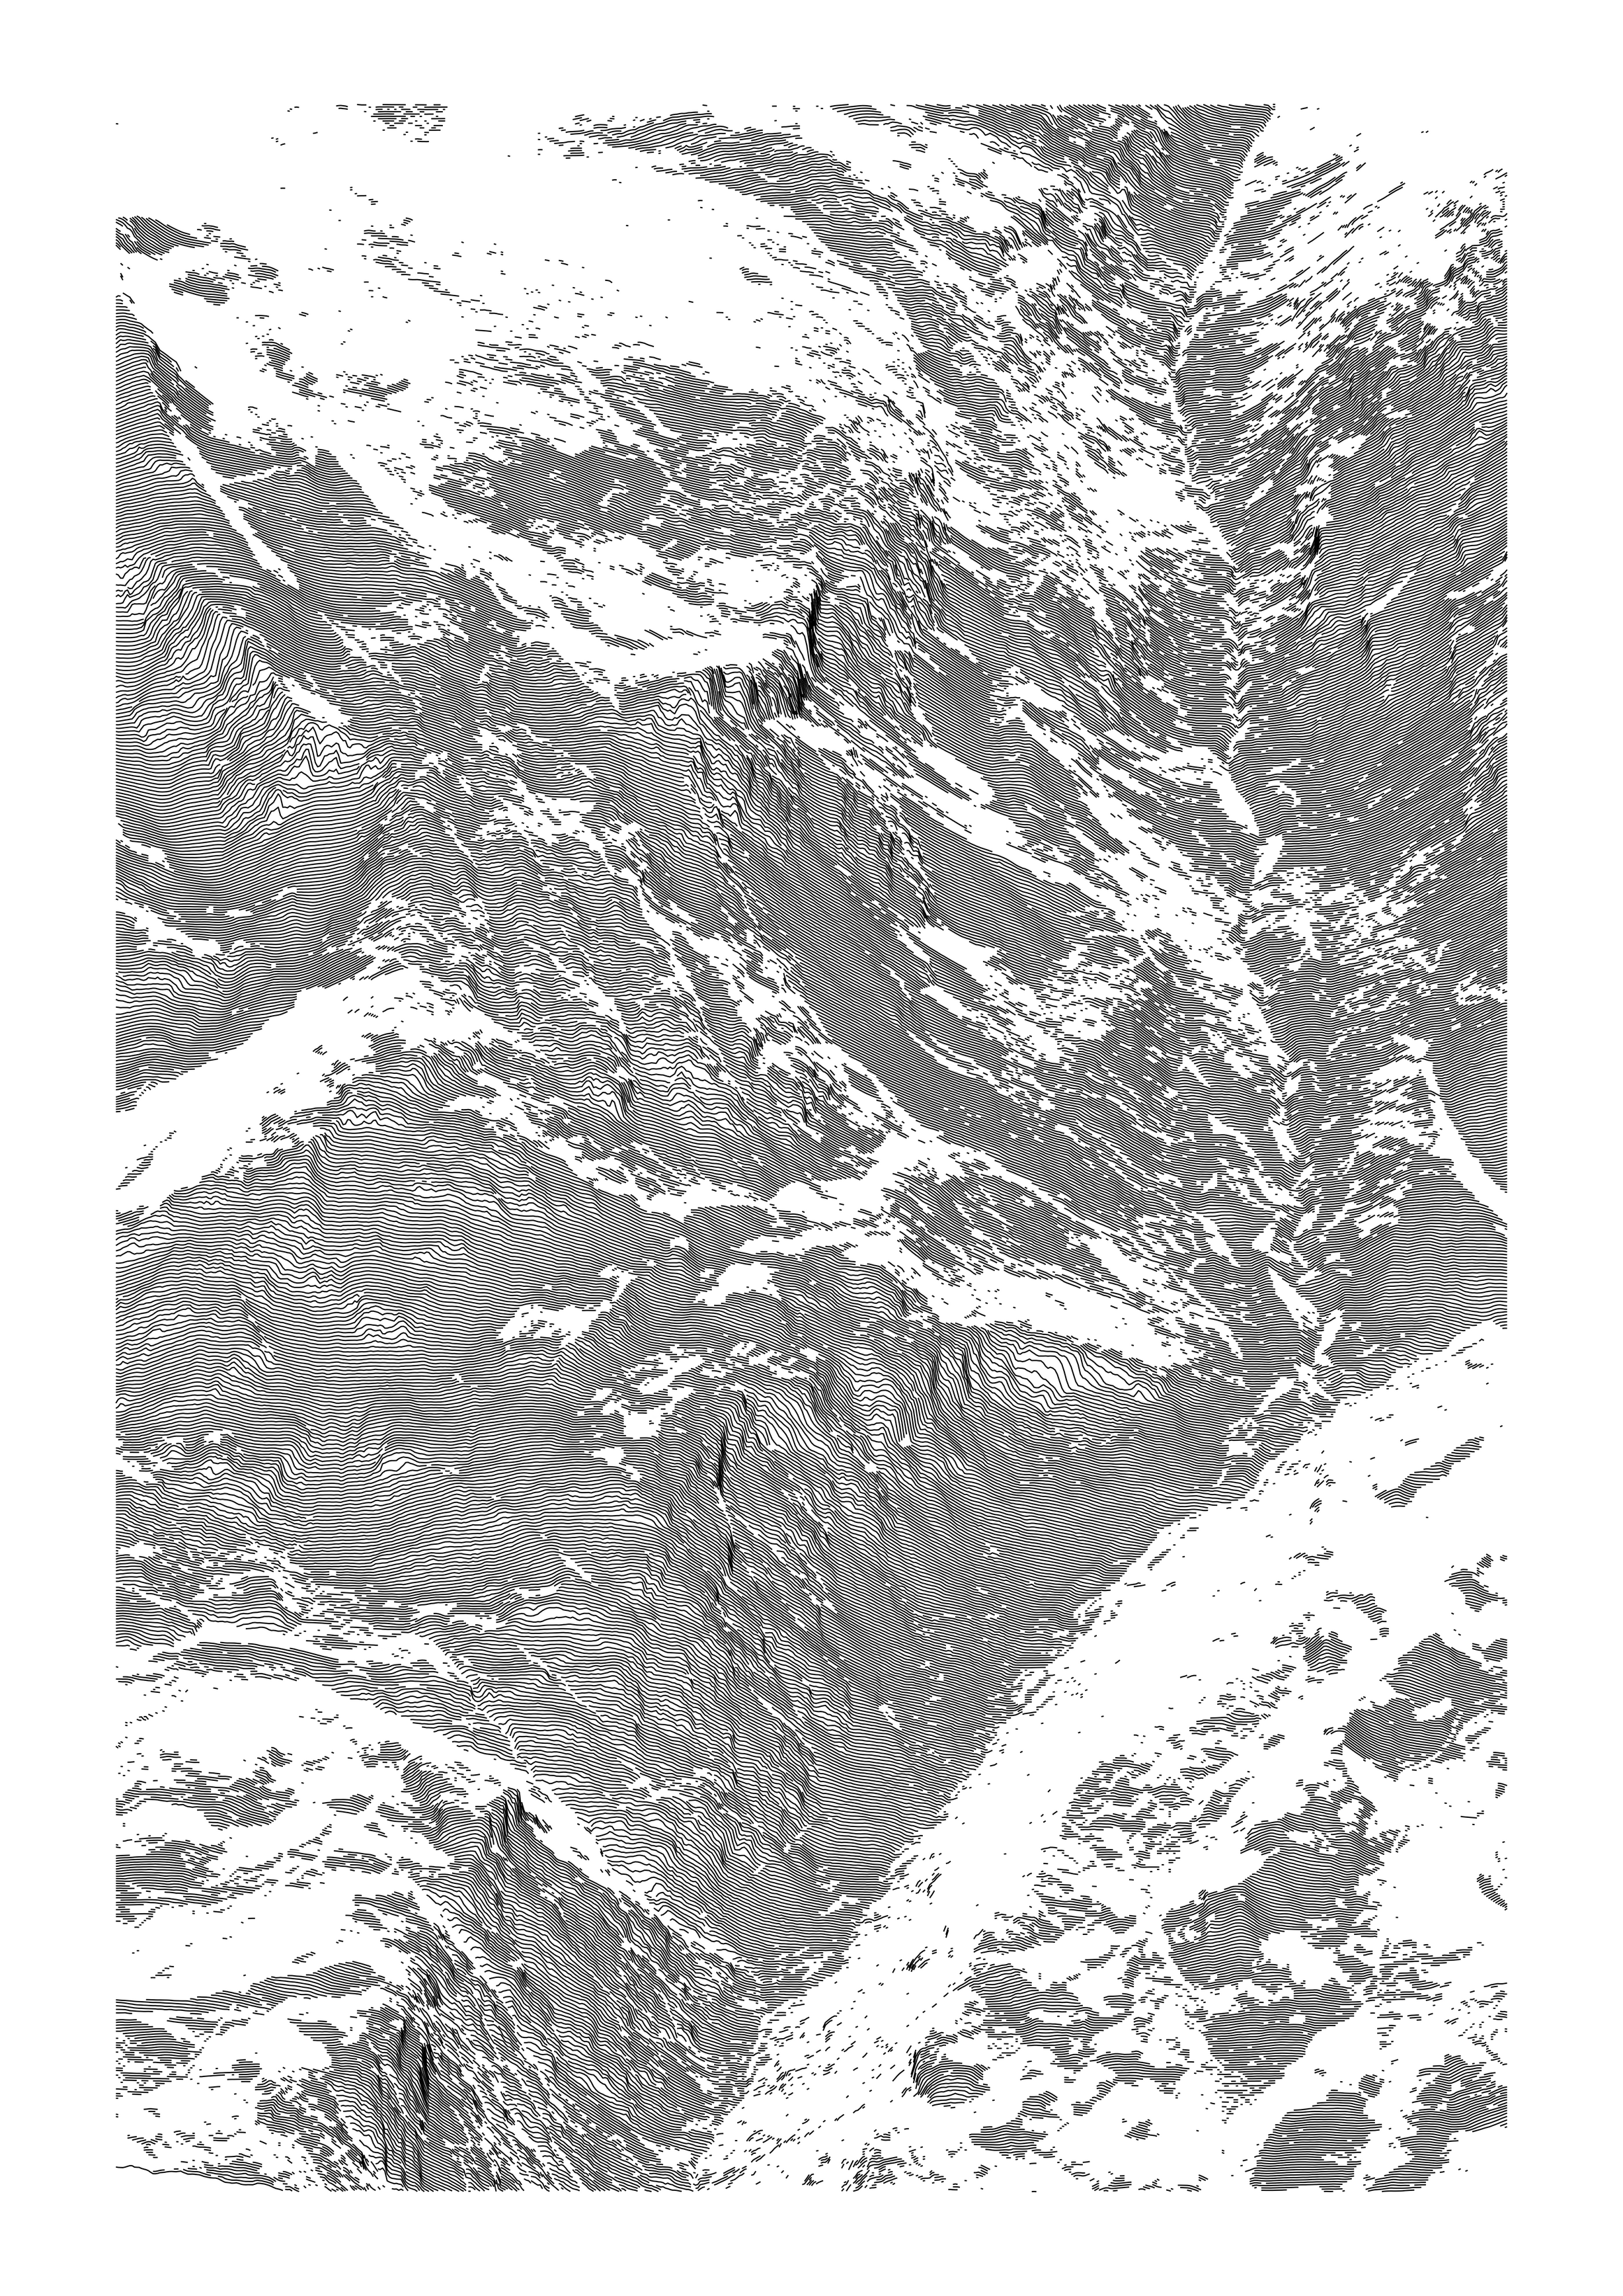
Distinct and shifted lines visualized from digital elevation model datasets.
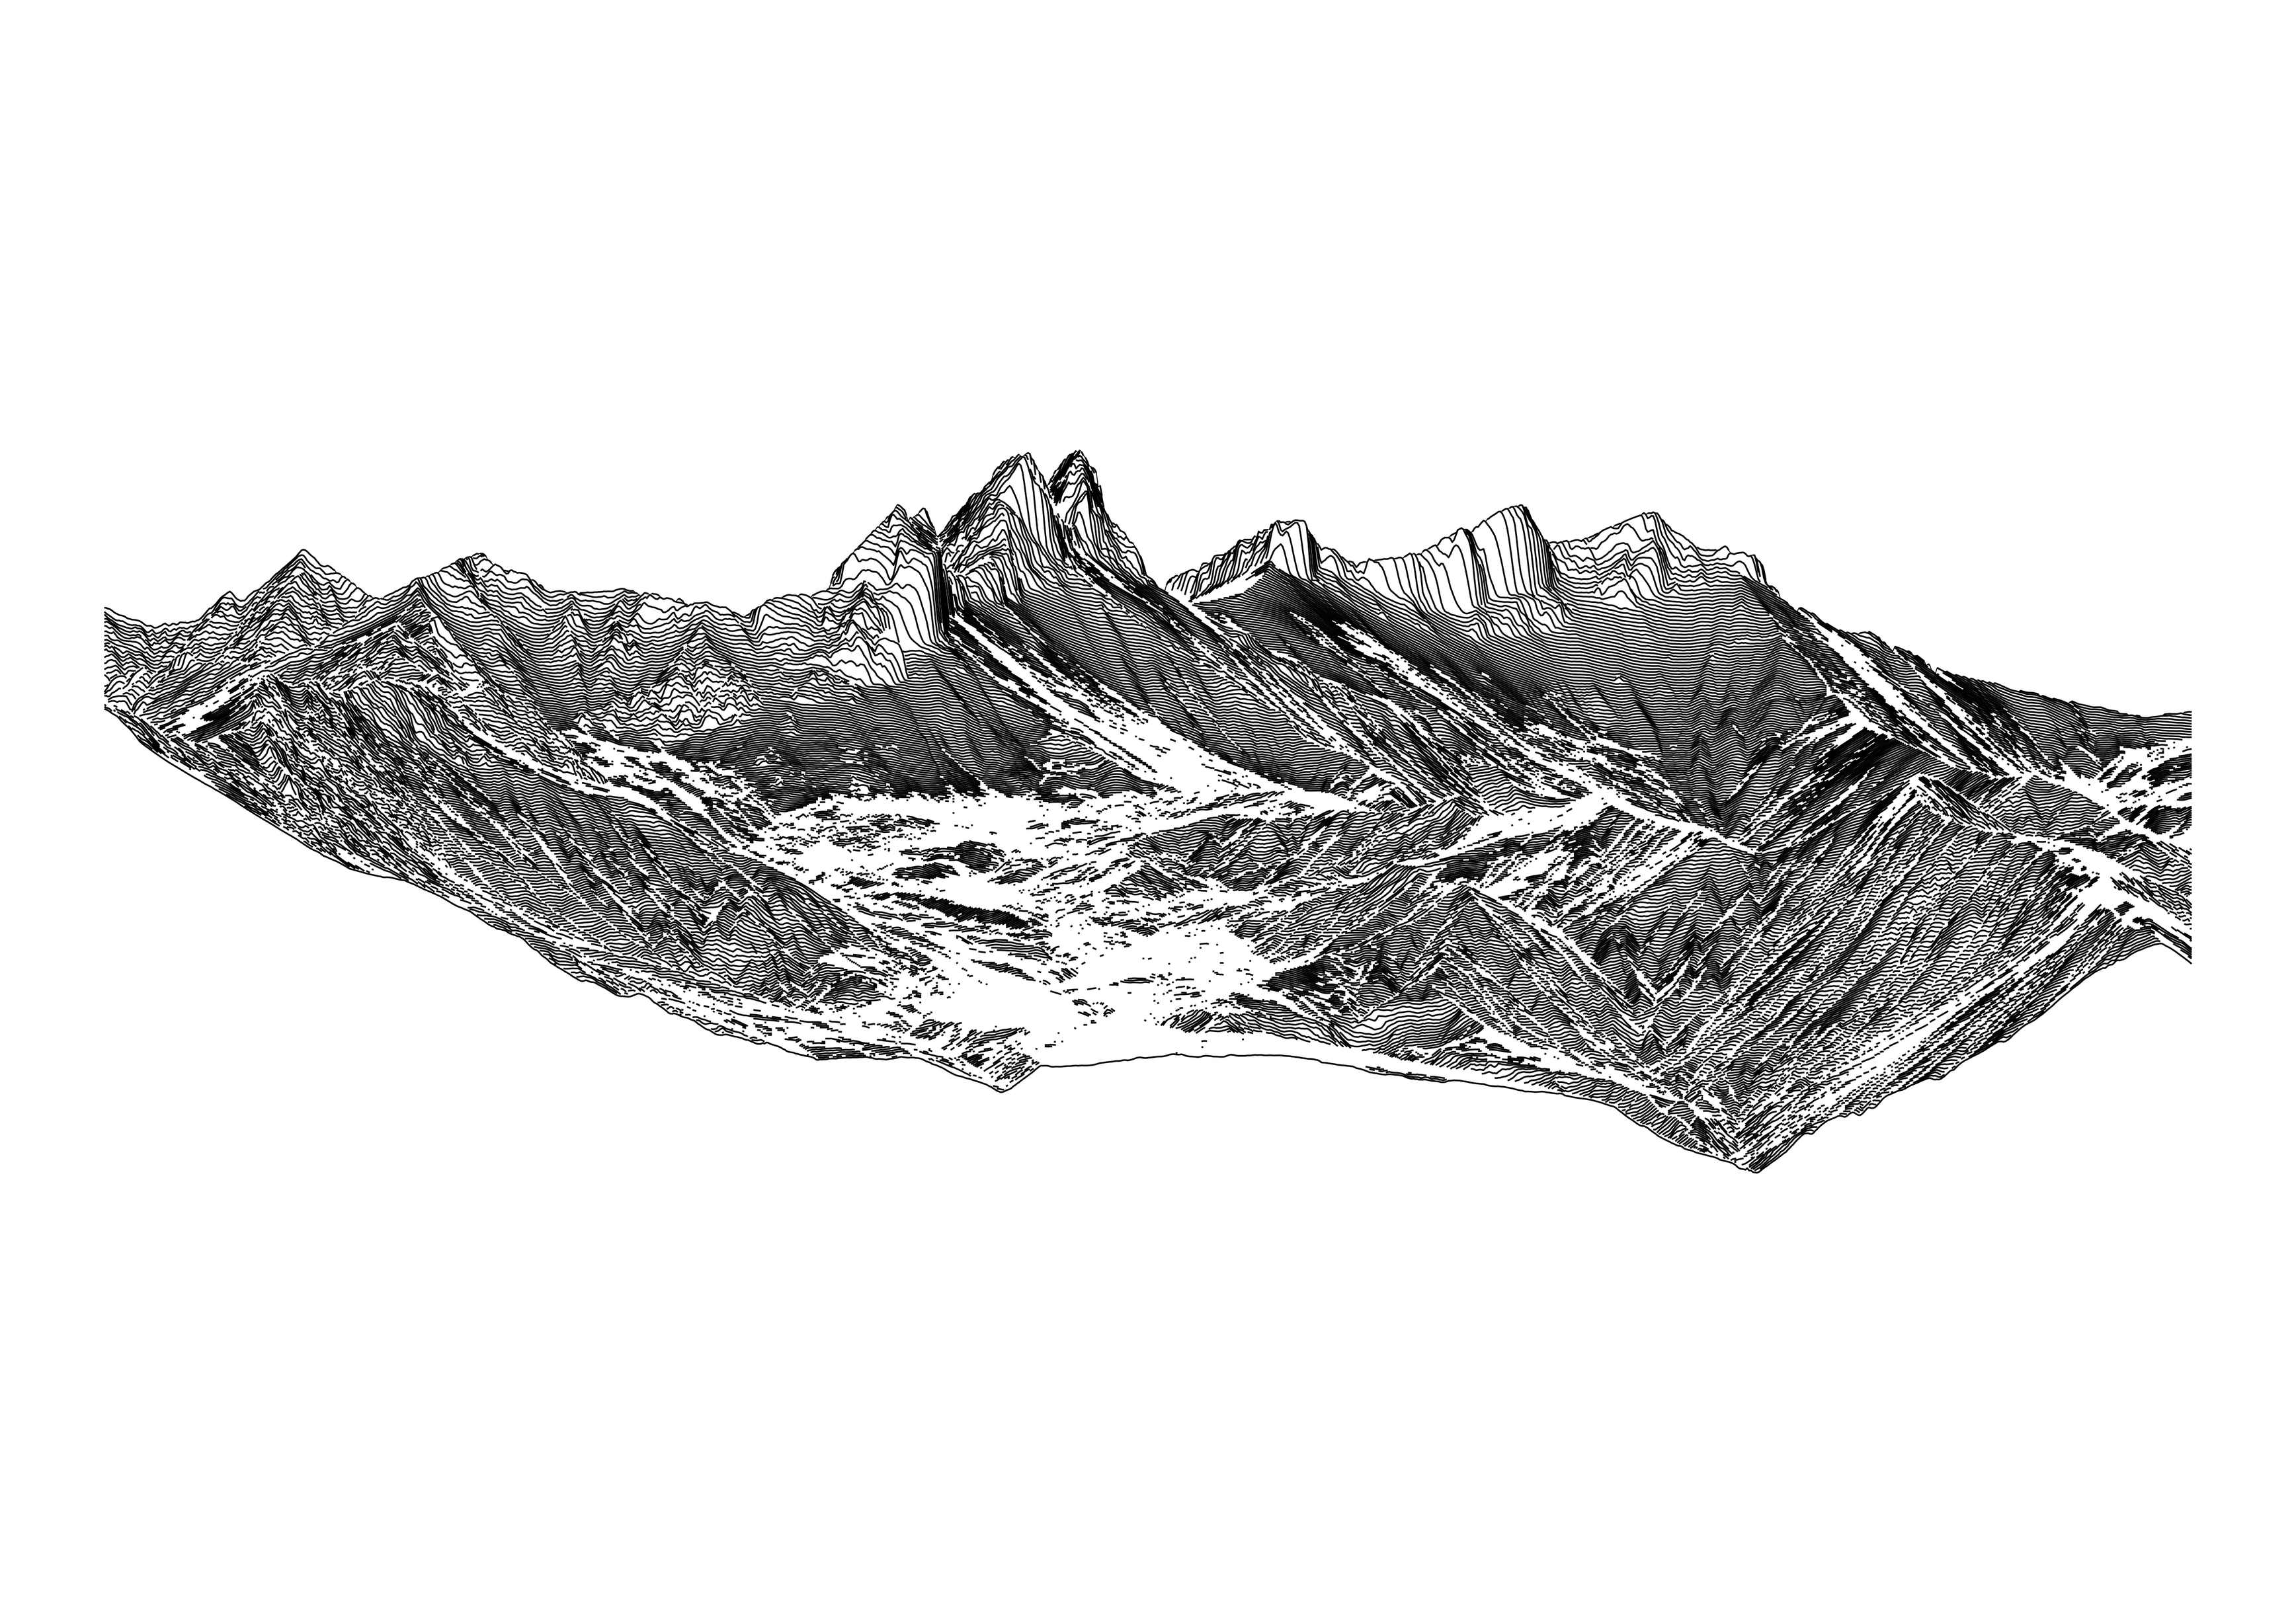
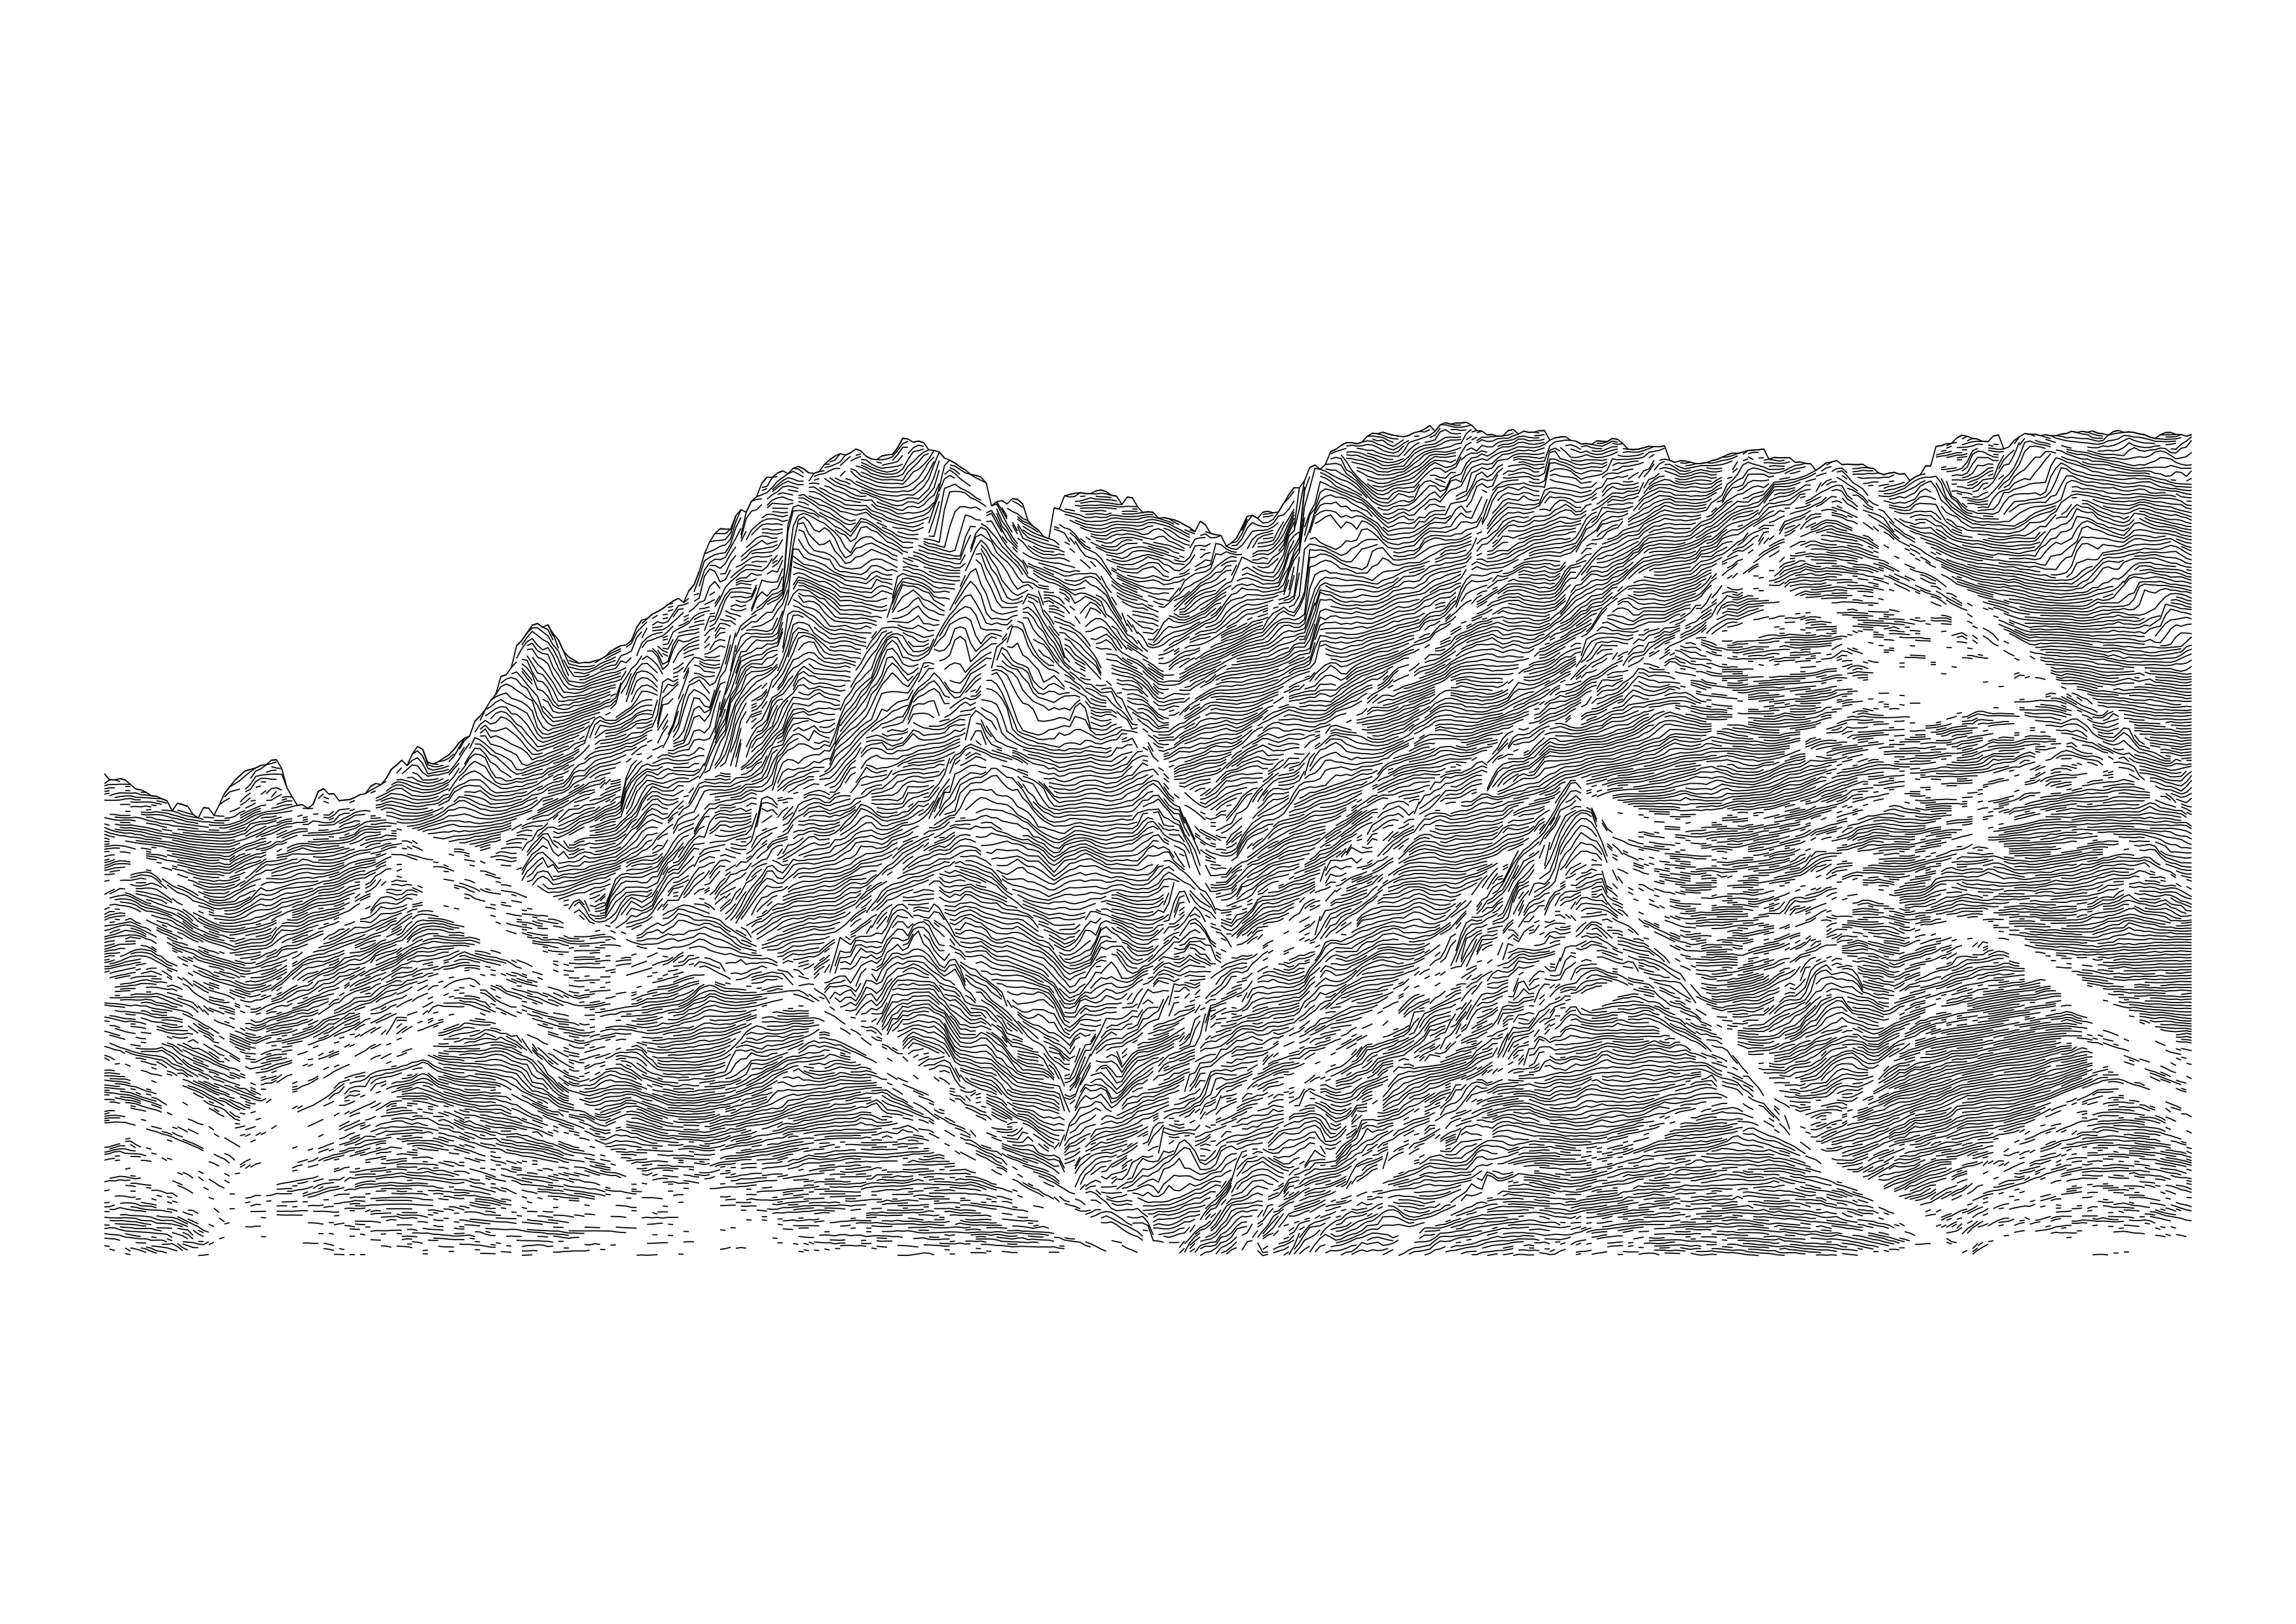
The central idea is to convert 3D point sets to 2D lines. Digital Elevation Model (DEM) represents elevation as a function of latitude and longitude. In France, the national geographic institute makes this DEM available in Open-Data (RGE, up to a 1m resolution). These illustrations are made of multiple lines of elevation as a function of longitude, for discrete latitude values. Overplotting is avoided (hidden lines) by checking for a minimal distance between two lines. Variation comes from the scale and location of the geographical region and from the parameterization of the line clipping method.
Adding noise or removing information from the original DEM data seems to create a more natural rendering. This option was explored in the dispyr series